White bread glycemic index
White bread has a glycemic index of 73, which is high. A 30 g serving (1 slice) has a glycemic load of 10 (low).
Also known as: sandwich bread, white toast
- Serving30 g
- Available carbs14 g
- Fiber0.8 g
- Sugars1.7 g
- Protein2.7 g
- Calories80 kcal
Serving: 1 slice.
What to know
White wheat bread averaged 73 across 35 studies and is often used as a reference food. Toasting, freezing and then toasting, or choosing sourdough or grainy breads can lower the response.
Glycemic load by portion size
GI stays the same whatever you eat, but glycemic load scales with the amount: eating twice as much doubles the effect on blood sugar.
| Amount | Available carbs | Glycemic load | |
|---|---|---|---|
| 50 g | 23 g | 17 | Medium |
| 100 g | 47 g | 34 | High |
| 30 g · 1 slice | 14 g | 10 | Low |
| 60 g · double serving | 28 g | 20 | High |
What the studies found
The value of 73 is the mean calculated by the authors of the International Tables of Glycemic Index (2021) across 68 studies. Results range from 42 to 94. That spread is normal: GI changes with variety, ripeness, cooking and processing, and between labs.
Each dot is one study. Green dots followed the ISO 26642 standard method.
- 42 · China 2020
- 43 · France 1998
- 50 · UK 2005
- 54 · Australia 2007
- 54 · UK 2006
- 54 · Canada 2013
- 56 · Canada 2013
- 56 · Canada 2013
- 59 · UK 2006
- 59 · Canada 2013
- 60 · USA 2011
- 62 · USA 2016
- 62 · UK 2006
- 63 · Canada 2011
- 63 · UK 2006
- 63 · Canada 2013
- 63 · Canada 2013
- 64 · Spain 2009
- 66 · Canada 2009
- 66 · UK 2006
- 67 · Australia 1998
- 67 · China 2013
- 68 · Canada 2009
- 68 · Spain 2013
- 68 · India 2012
- 69 · Canada 2009
- 69 · Canada 1981
- 70 · Australia 2010
- 70 · Australia 1999
- 70 · Canada 2011
- 70 · USA 1980
- 71 · n/a 2001
- 71 · UK 2007
- 71 · USA 2006
- 71 · Canada 2011
- 71 · South Africa 1984
- 71 · Korea 2018
- 72 · Canada 2009
- 72 · Canada 2009
- 72 · Canada 1992
- 72 · Canada 1983
- 72 · Italy 2006
- 74 · Australia 2014
- 74 · Italy 1999
- 75 · Canada 2009
- 75 · Japan 2003
- 75 · Czech Republic 2003
- 75 · UK 2006
- 76 · Canada 2009
- 76 · Spain 2013
- 76 · n/a 2001
- 76 · Italy 2007
- 77 · New Zealand 2000
- 77 · Sri Lanka 2009
- 78 · Canada 2009
- 78 · Israel 1988
- 80 · Australia 1998
- 83 · Malaysia 2009
- 83 · Singapore 2015
- 86 · Spain 2013
- 87 · China 2020
- 87 · UK 2006
- 88 · China 2005
- 88 · China 2005
- 89 · UK 2006
- 89 · Italy 2001
- 93 · Czech Republic 2007
- 94 · Nigeria 2017
White bread compared with other bread & bakery
Lower-GI swaps
Know the glycemic index of any meal from a photo
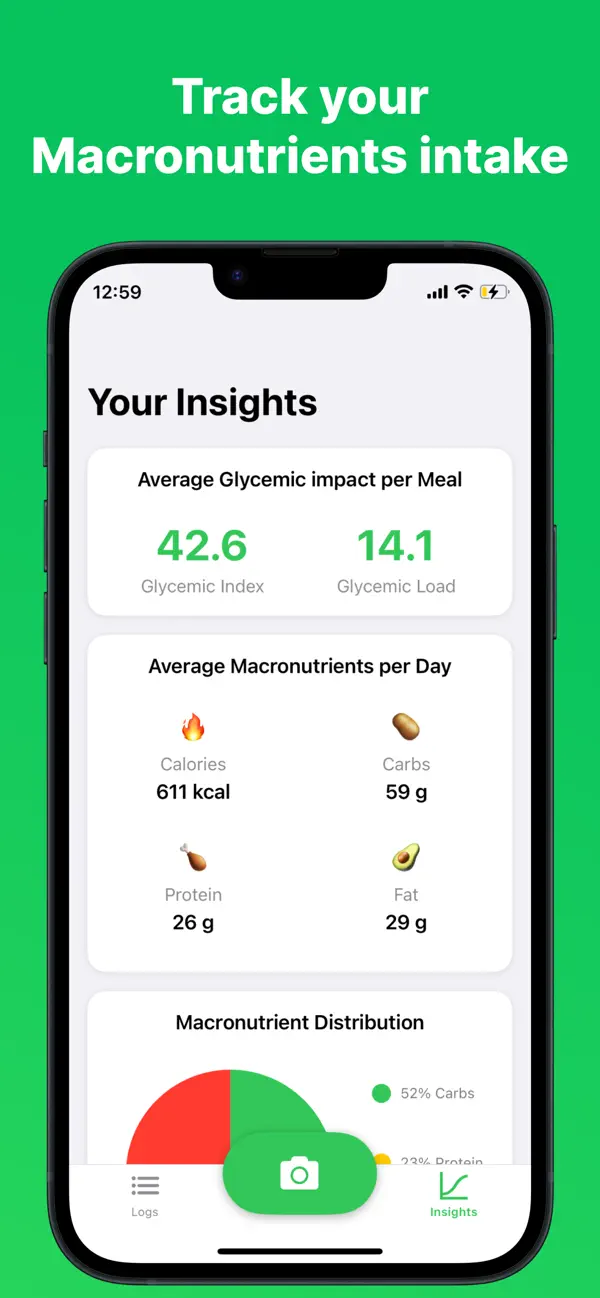
Tables work for single foods. The app estimates the GI and glycemic load of your whole plate, with real portions.
- Scan your plate or just describe it
- GI, glycemic load, calories and macros
- An AI nutritionist that knows your meals


Frequently asked questions
Is white bread low glycemic?
No. With a GI of 73, white bread is in the high range (70 or more). Low GI is 55 or less.
What is the glycemic load of white bread?
A 30 g serving (1 slice) has a glycemic load of 10, which is low. Glycemic load combines GI with the amount of carbohydrate in the portion: 10 or less is low, 11 to 19 medium and 20 or more high.
Can people with diabetes eat white bread?
With a GI of 73 and a low glycemic load per serving, white bread usually fits a diabetes-friendly diet in normal portions. Everyone responds differently, so talk to your doctor or dietitian about your plan.
How many carbs are in white bread?
A 30 g serving has about 15 g of total carbohydrate, including 0.8 g of fiber, leaving 14 g of available carbohydrate (the part that raises blood sugar). Per 100 g: 49.4 g of carbohydrate.
Nutrition facts
| per 100 g | Serving (30 g) | |
|---|---|---|
| Calories | 266 kcal | 80 kcal |
| Carbohydrates | 49 g | 15 g |
| Available carbs | 47 g | 14 g |
| Fiber | 2.7 g | 0.8 g |
| Sugars | 5.7 g | 1.7 g |
| Protein | 8.9 g | 2.7 g |
| Fat | 3.3 g | 1 g |
Source: USDA FoodData Central, Bread, white, commercially prepared (includes soft bread crumbs) (SR Legacy, FDC 174924). Available carbohydrate = total carbohydrate minus fiber.
Sources: Atkinson FS, Brand-Miller JC, Foster-Powell K, Buyken AE, Goletzke J. International tables of glycemic index and glycemic load values 2021: a systematic review. Am J Clin Nutr. 2021;114(5):1625–1632. USDA FoodData Central. How we calculate each value: Methodology & sources.
Data last reviewed 2026-09-29.