8 foods · 6 low GI
Glycemic index of dishes
Mixed dishes usually have a lower GI than their main starch alone, because protein, fat, fiber and acidity all slow digestion. These values come from studies that tested the whole dish.
| Serving | Level | |||
|---|---|---|---|---|
| Quesadillacheese quesadilla | 36 | 14 | 150 g | Low |
| Burritobean burrito | 37 | 17 | 150 g | Low |
| Minestroneminestrone soup | 47 | 10 | 250 g | Low |
| Sushisushi rolls | 48 | 13 | 150 g | Low |
| Pizzacheese pizza | 54 | 22 | 150 g | Low |
| Dosadosai | 55 | 19 | 100 g | Low |
| Mac and cheesemacaroni and cheese | 65 | 13 | 180 g | Medium |
| Idlirice idli | 77 | 15 | 100 g | High |
Glycemic Index AI Food Scanner
Know the glycemic index of any meal from a photo
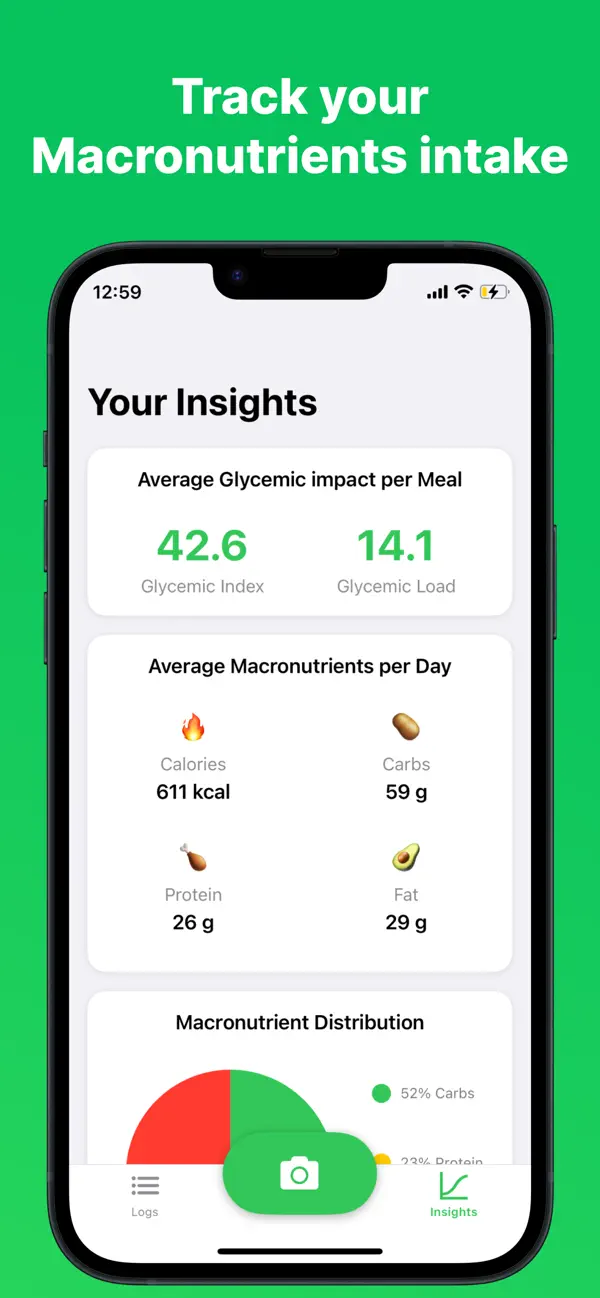
Tables work for single foods. The app estimates the GI and glycemic load of your whole plate, with real portions.
- Scan your plate or just describe it
- GI, glycemic load, calories and macros
- An AI nutritionist that knows your meals


Other categories
Fruits25 foodsVegetables & tubers32 foodsGrains & rice20 foodsBread & bakery17 foodsPasta & noodles10 foodsBreakfast cereals7 foodsLegumes13 foodsDairy & plant milks9 foodsNuts & seeds8 foodsSnacks & crackers8 foodsSweets & desserts18 foodsSugars & sweeteners8 foodsDrinks11 foodsMeat, fish & eggs8 foodsOils & fats2 foods
Sources: Atkinson FS et al. International tables of glycemic index and glycemic load values 2021. Am J Clin Nutr. 2021;114(5):1625–1632 · USDA FoodData Central · Methodology & sources · Data last reviewed 2026-09-29.